How to Evaluate an HRV Wearable
Accuracy, Sampling Time, and What Actually Matters
HRV Is Not Just a Stress Score
Heart Rate Variability (HRV) has become one of the most marketed health metrics in modern wearables. It is often framed as:
A stress score
A recovery score
A readiness metric
A proxy for autonomic balance
But HRV is much more than a sympathetic versus parasympathetic tug-of-war.
As Ernst (2017) argues, HRV reflects the dynamic interaction between brain and cardiovascular regulation — not simply autonomic tone. It represents the behavior of a complex adaptive system.
When we reduce HRV to a single daily number, we risk misunderstanding what variability actually means.
What Is Variability? A Dynamic Systems Perspective
When most people hear “variability,” they think inconsistency or error.
In biological systems, variability is neither noise nor mistake. It is information.
Dynamic Systems Theory (DST) suggests that healthy systems are:
Not rigid
Not random
But dynamically adaptable
Stergiou et al (2006) describe this as optimal variability — a state between rigidity and instability. Too little variability leads to mechanical repetition. Too much variability leads to instability without control.
Sturmberg et al (2015) extend this concept across the lifespan, describing how aging and disease are associated with loss of physiological complexity and reduced variability.
Health, in this framework, is not perfect regularity. It is organized complexity.
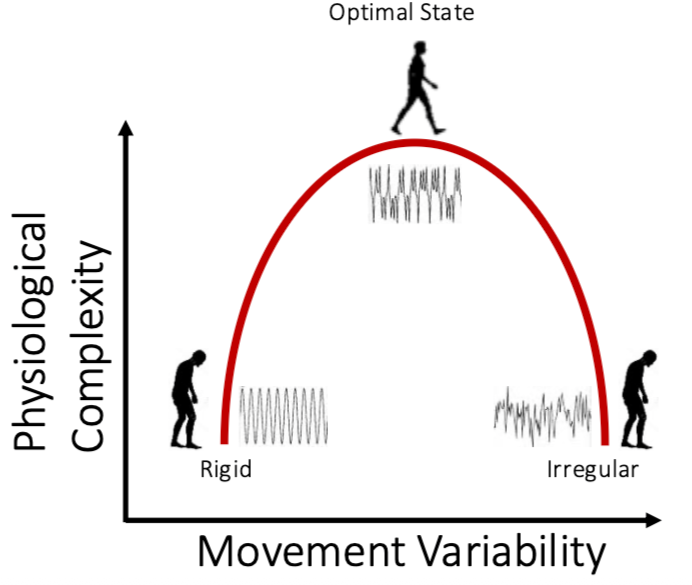
Figure 1: Inverted-U model of physiological complexity (rigid → optimal → irregular)
This inverted-U model captures the central idea:
Left side: rigid, periodic, low complexity
Right side: noisy, unstable, low complexity
Middle: structured, adaptable, complex
Healthy biological rhythms live in the middle.
But here is the critical question:
How do we determine where a person/cardiovascular system sits on that curve?
To answer that, we must understand how variability is measured.
Why One Minute Is Usually Not Enough
HRV analysis depends on accurate R-R interval detection. The Task Force standards recommend ECG sampling rates of at least 250–500 Hz for precise interval measurement (Task Force, 1996).
Short recordings of 30–60 seconds can estimate certain simple HRV measures (like short-term beat-to-beat differences).
However, this cannot reliably capture:
Whether the rhythm has repeating structure
Whether it shows healthy complexity
How patterns evolve over time
Whether variability is organized or random
A complex system can look random if you only observe it briefly. Its structure becomes clear only when you observe it over enough time.
If we are attempting to measure adaptability, we must measure enough data to detect organization — not just magnitude.
To see why this matters, consider three simple signals.
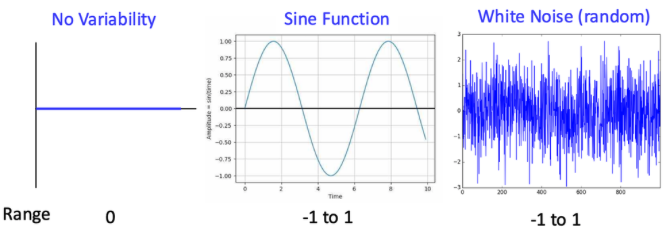
Figure 2: Three time series — flat line, sine wave, white noise (linear vs nonlinear variability slide)
Why “Variability” Is Not Just How Big the Swings Are
The three signals shown above are:
A flat line (no variability)
A smooth sine wave (perfectly periodic)
White noise (random fluctuations)
If we calculate variability using linear measures such as standard deviation or range:
The flat line = zero variability
The sine wave = moderate variability
The white noise = similar moderate variability
The sine wave and white noise can have the same range and similar standard deviation.
Linear measures treat them as comparable.
But physiologically, they represent completely different systems.
What Linear Measures “See”
Linear measures such as SDNN, RMSSD, and range answer one question:
“How far apart are the numbers?”
They do not consider:
The order in which beats occur
The structure across time
Whether the pattern is organized
They quantify magnitude, not meaning.
In the graphs above:
The sine wave looks appropriately variable.
The white noise looks equally variable.
But one is rigid. The other is unstable.
Neither reflects optimal complexity.
What Nonlinear Measures “See”
Nonlinear measures such as entropy, Lyapunov exponent, and detrended fluctuation analysis ask a different question:
“How is this pattern organized across time?”
Now the signals separate clearly:
The sine wave is perfectly predictable and low in complexity.
The white noise is completely unpredictable and also low in complexity.
Healthy biological rhythms fall between these extremes (Stergiou et al, 2006).
They are structured but not repetitive.
They are adaptable but not random.
This is the middle of the inverted-U curve — optimal variability.
Complexity is not about how large the swings are. It is about how the system evolves over time. And that cannot be determined from a handful of beats.
Why This Matters for HRV Wearables
Most consumer devices calculate magnitude-based metrics such as:
rMSSD
SDNN
LF/HF ratio
These metrics quantify how much variability exists.
They do not quantify how it is organized.
That means:
A rigid, mechanically periodic breathing pattern AND A noisy, unstable signal.
Could produce similar linear HRV magnitude.
Without sufficient sampling time and structural analysis, magnitude alone cannot distinguish adaptability from noise.
Where the Device Measures Matters
Different sensor locations introduce trade-offs.
Chest Strap (ECG)
Pros:
Direct electrical R-R detection
Gold standard for HRV
Cons:
Less convenient
Not ideal for continuous wear
Finger (PPG)
Pros:
Often stable during still measurements
Cons:
Sensitive to vasoconstriction
Motion artifact possible
Wrist (PPG)
Pros:
Convenient
Continuous
Cons:
More motion artifact
Lower R-R precision
PPG-derived HRV estimates timing from pulse wave arrival. ECG measures electrical depolarization directly. These are not equivalent signals.
What to Look for in Validation Studies
Before purchasing or recommending a wearable, look for:
Gold-standard comparison against ECG
Bland–Altman plots showing agreement
Sampling frequency disclosure
Recording duration transparency
Artifact correction methods
Peer-reviewed publication
Independent replication
Correlation alone is not validation.
Anchoring HRV in Clinical Physiology
HRV reflects brain–heart interaction and systemic adaptability (Ernst, 2017).
Reduced variability has been associated with aging and disease states characterized by loss of complexity (Sturmberg et al, 2015).
Health is not perfect regularity.
Health is adaptable complexity.
But that principle only holds if variability is measured appropriately.
The Bottom Line
HRV is not simply a stress score.
It is a window into the body’s organization.
Variability requires time.
Complexity requires structure.
Structure requires sufficient sampling.
A 60-second optical estimate may approximate short-term vagal tone. It does not characterize physiological complexity.
If we are going to use HRV to talk about resilience, recovery, and adaptability, we must use the science of variability.
Author’s Note:
I have a background in biomedical engineering and have studied dynamic systems theory and physiological variability in both research and clinical settings. My work has included HRV analysis in research environments, and at the time of this post I’m completing medical training. This perspective shapes how I evaluate health technology and measurement validity.
References
Ernst G. Heart-rate variability—more than heart beats? Front Public Health. 2017;5:240. doi:10.3389/fpubh.2017.00240
Stergiou N, Harbourne RT, Cavanaugh JT. Optimal movement variability: a new theoretical perspective for neurologic physical therapy. J Neurol Phys Ther. 2006;30(3):120–129.
Sturmberg JP, Bennett JM, Picard M, Seely AJE. The trajectory of life: decreasing physiological network complexity through changing fractal patterns. Front Physiol. 2015;6:169. doi:10.3389/fphys.2015.00169
Task Force of the European Society of Cardiology and the North American Society of Pacing and Electrophysiology. Heart rate variability: standards of measurement, physiological interpretation, and clinical use. Circulation. 1996;93(5):1043–1065.